5.0 Liquefaction and Ground Failure
Liquefaction and ground failure was widespread throughout the Mexicali Valley south of the border, and also present in the Imperial Valley north of the border at sites adjacent to bodies of water. This chapter is divided into sections south and north of the border because (1) GEER teams tended to focus either south or north of the border, (2) sites fall under different jurisdictions depending on whether they are in Mexico or the U.S., which could be important for follow-up efforts, and (3) liquefaction was widespread and extensive south of the border, whereas its extent was limited to locations near water bodies north of the border.
5.1 Observations South of the Border
The GEER team coordinated two separate trips to document effects of liquefaction south of the border. The first trip was made on April 10th, 2010 by Jorge Meneses (Kleinfelder), Diane Murbach (City of San Diego), James Gingery (Kleinfelder/UCSD), and David Ayres (UCLA). Efforts were coordinated with Mario Valdez, and employee of SIDUE. Mario was aware of the sites of interest, and could gain access to several locations that would have been inaccessible without his help. The trip focused on obtaining a broad overview of liquefaction-induced damage south of the border. The second trip was made one week later on April 17th, 2010 by Jorge Meneses, David Ayres, Scott Brandenberg, Tara Hutchinson, and Richard Wood. This effort focused more specifically on a few sites of interest that had been identified during the previous week's reconnaissance efforts. Tom Rockwell and his colleagues also observed evidence of liquefaction in the Laguna Salada basin, but their primary focus was documenting surface fault rupture, and their liquefaction observations are not presented herein.
Liquefaction south of the border was widespread, particularly in the largely agricultural Mexicali Valley. Many irrigation canals were destroyed by liquefaction due to settlement, lateral spreading, and ejected sand filling the canals, and many fields of wheat and hay became submerged due to subsidence and the high ground water table throughout the region. Liquefaction was so widespread throughout the valley that the GEER team could not adequately quantify its extent in the time available. Hence, our observations of liquefaction south of the border are not an exhaustive account, and additional information will be needed to fully characterize the extent of liquefaction and its influence, particularly on agriculture in the region. Given that the extent of liquefaction was too large to adequately cover, our efforts focused on recording detailed perishable data at a number of sites of interest. First was the San Felipito Bridge site, where liquefaction and lateral spreading caused a span of a railway bridge to collapse, but did not cause spans of an adjacent highway bridge to collapse. The highway bridge did suffer some settlement-induced damage. Second is a set of buildings and a pedestrian bridge at the Universidad Autonoma de Baja California campus, which were rendered un-operational due to liquefaction-induced settlement and some small lateral ground deformations. Third, a government-owned structure that was near completion at the time of the earthquake suffered differential settlement apparently due to liquefaction, though no surface evidence was observed. Lastly, a discussion is provided on the liquefaction effects on agricultural and residential areas in the Mexicali Valley.
5.1.1 San Felipito Bridges
The San Felipito bridge site consists of a Sonora-Baja California railway bridge and Carretera Luis B Sanchez el Faro highway bridge that cross the Colorado River about 6 km southeast of Guadalupe Victoria, Baja California. The nearest ground motion station in Riito is approximately 12 km southeast of the bridge site, and recorded a peak horizontal ground acceleration of 0.4g. The two bridges are adjacent and parallel to each other, and cross the river in the east-west direction. The river flows from north to south toward the Colorado River delta. Both bridges have simply-supported spans, but different pier and foundation configurations, and suffered different amounts of damage as a result of liquefaction and lateral spreading at the site. The different performance exhibited by these bridges makes this an extremely valuable case history for the purpose of validating engineering evaluation procedures since both bridges were subject to similar lateral spreading demands.
5.1.1.1 Liquefaction and Lateral Spreading
Signs of liquefaction and lateral spreading were apparent in the floodplain on both sides of the river, with more lateral deformation occurring to the east of the river (Fig. 5-1). The river currently flows through the western margin of its floodplain at the bridge site, hence the young liquefiable alluvium extended further landward on the east side of the river, explaining the larger lateral spreading. Ground cracking caused by lateral spreading on the west bank of the river just south of the bridges is shown in Figure 5-2. Ground cracks were mapped at three locations in the floodplain on April 17, 2010. A long tape measure was laid across the ground surface, and lateral crack thickness was measured as a function of distance along the tape (Fig. 5-3). GPS waypoints were recorded at the start and end stations of the tape measure for georeferencing. Repair efforts and re-grading prevented measurement of ground cracks along the bridge axis, hence efforts focused on the floodplain to the north and south of the bridge where valid measurements could be made.
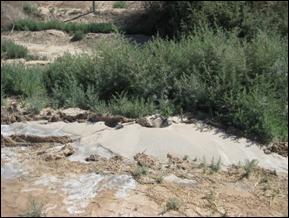
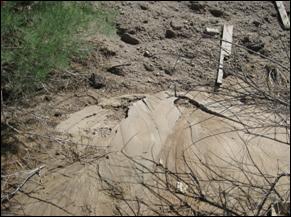
Transect 1 was measured east of the river approximately 60m north of the railway bridge. Crack widths were measured along a line perpendicular to the river bank, and the sum of the crack widths was 4.6m. Most of the total crack width was attributed to three large ground cracks approximately 40m to 60m landward from the riverbank, where heavy brush covered the ground and obscured overhead view of the cracks (Fig. 5-4). Each crack had a width and depth of more than 1m, and saturated clean fine sand was encountered in the bottom of the cracks. Access was difficult, and only the two cracks nearest to the river could be measured, while the third could only be visually inspected from a distance of about 5m. Additional cracks could have existed further to the east, but this region was inaccessible. The sand in the cracks was easily re-liquefied and began pumping underfoot. The crust material atop the liquefied sand was composed of unsaturated silts and fine sands. The actual lateral spreading ground displacement was likely larger than 4.6m because lateral deformation is attributed to crack formation (measured) and extensional strains in the crust material (not measurable). A zone of extension was encountered near the river bank where the river had washed away cracks, though lateral extension was still apparent (Fig. 5-5). The floodplain to the east of the river south of the bridges was covered too heavily with brush to permit access, so measurements were not made in this region.
Crack widths along two transects were measured on the west bank of the river at distances of 30m and 60m south of the highway bridge. This region was easily accessible with very little brush covering the ground. The sum of the crack widths was 1.0m at a distance of 30m to the south of the bridge, and 1.6m at a distance of 60m to the south of the bridge. Ground cracks were not apparent along the bridge axis, and appeared that ground displacements were small near the bridge and increased with distance to the south and north. One possible explanation for the increase in ground displacement with distance from the bridge is that the bridge components attracted lateral loads from the spreading soil, and these loads in turn resisted lateral spreading of the soil along the bridge axis. The west riverbank to the north of the bridges was covered with heavy brush and ground cracks were therefore not measured here.
A drill rig was deployed to the site on April 17th at the time of our investigation by Secretaria de Comunicaciones y Transportes, the responsible agency for the highway bridge. The borehole was conducted immediately south of the highway bridge near the pier where the railway bridge span unseated. Water was pumped from the river and jetted into the cased borehole to advance the hole, and standard penetration testing was performed using a donut hammer operated with rope and cathead. The soil profile consisted of 6m of silt over 5.4m of loose sand over dense sand. The groundwater table was encountered at a depth of 2m. The lowest blow count measured during their investigation was N=12 in the loose sand layer. It is impossible to know whether this N-value is meaningful for liquefaction evaluation purposes because (1) hammer energy is unknown, and (2) the erosive drilling method may significantly disturb the soil at the bottom of the hole. Nevertheless, the stratigraphy from the site investigation is useful. An additional geotechnical site investigation may be required as a follow-up to our preliminary reconnaissance efforts to more fully extract useful geotechnical information from this case history.
5.1.1.2 Structural Response
The railway bridge was constructed in 1962 by Ferrocarril Sonora-Baja California, and is currently maintained by Ferrocarril Mexicano since Ferrocarril Sonora-Baja California no longer exists. The bridge consists of precast-prestressed reinforced concrete girders supported by reinforced concrete piers resting on driven piles. Each span consists of three girders resting atop elastomeric bearings on the pier caps. Lateral spreading caused the piers nearest to the river to rotate and translate riverward, causing unseating of one span on the east side of the river, and nearly causing unseating of two spans on the west side of the river. Lateral spreading of both banks toward the river placed lateral demands on the foundations that were transmitted through the piers and bearings, thereby placing compressive demands on the superstructure. This limited permanent longitudinal deformation of each span. When force demands exceeded the lateral capacity of the bearings, the piers began sliding out from underneath the superstructure. Displacement of the pier on the east bank was just large enough to cause unseating of the span (Fig. 5-6), whereas displacement of two piers on the west bank left only a few centimeters of seat length (Fig. 5-7). A temporary steel frame was constructed to support two spans on the west bank. A temporary steel span was erected within two weeks of the earthquake to put the railroad bridge back in service.
The highway bridge was constructed in 2001 as a replacement for an older bridge and is currently maintained by Secretaria de Comunicaciones y Transportes. Each bent consists of four 2m diameter extended shafts connected by a bent cap. The superstructure consists of long spans composed of seven precast-prestressed concrete T-girders that rest atop elastomeric bearings on the pier caps. Small tension cracks (i.e. generally smaller than 1mm thick) formed just above ground level on the riverward face of the piers nearest to the river, indicating some small permanent foundation displacement. Relative displacement between the superstructure and pier caps in the longitudinal direction was not apparent for any span of the highway bridge. Some elastomeric bearings exhibited offsets in the transverse direction and some shear keys had formed cracks and/or exhibited some spalling, which was likely caused by strong ground shaking. The evidence indicates that the foundations for the highway bridge resisted lateral spreading demands better than those for the railway bridge, thereby limiting displacements at the bottom of the pier columns. Force demands at the tops of the highway bridge piers did not exceed the capacity of the elastomeric bearings, thereby eliminating the potential for unseating.
One or more piers of the highway bridge on the east bank of the river settled as much of 0.5 m (Fig. 5-8). The ground surface around the pier that settled the most had displaced about 0.5 meters more than the bridge columns (Fig. 5-9). The bridge pier settlement is likely the result of liquefaction settlement-related down drag or the partial loss of bearing capacity in the drilled shaft foundations, though additional data and analysis are needed to confirm this.
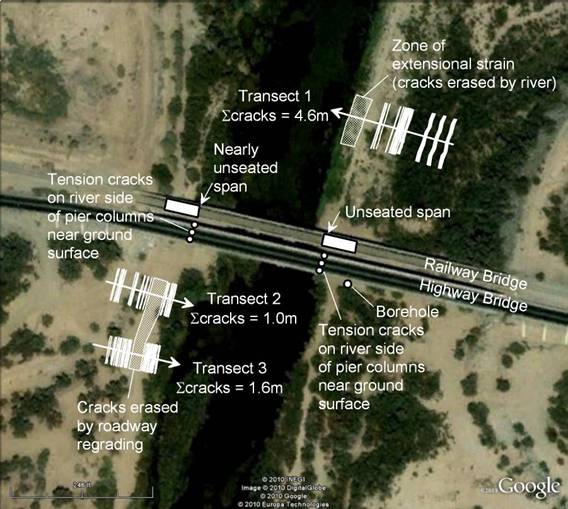
Figure 5-1. Lateral spreading ground displacements and effects on the San Felipito Bridges.
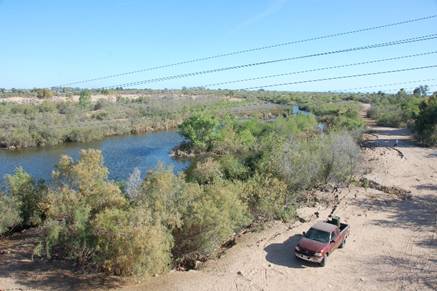
Figure 5-2. Lateral spreading ground cracking along the Colorado river bank adjacent to the highway and railroad bridges. The transect 2 and 3 areas are shown in the lower right part of the photograph (N32.24425° W115.05385°).
Photo by Jim Gingery, April 10, 2010.
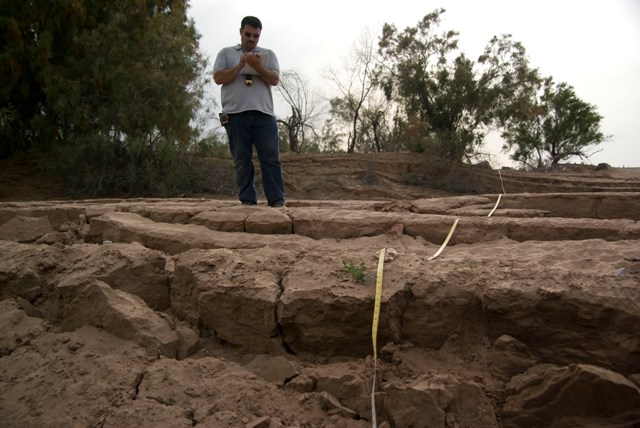
Figure 5-3. Measurements of ground cracks along transect 3
(N32.243984° W115.053935°).
Photo by Scott Brandenberg, April 17, 2010.
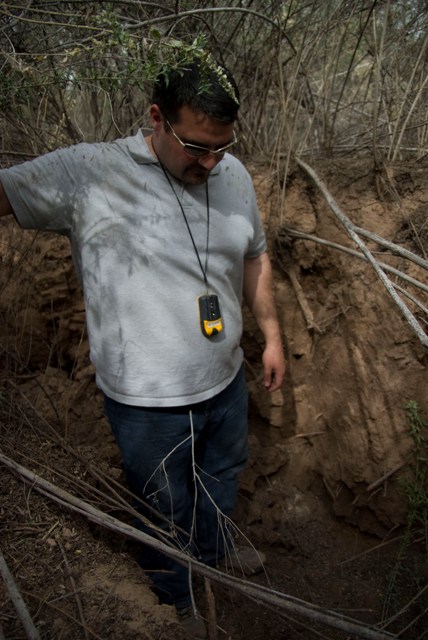
Figure 5-4. Reconnaissance team member David Ayres standing in one of the large cracks along transect 1 (N32.244706° W115.052453°). Photo by Scott Brandenberg, April 17, 2010.
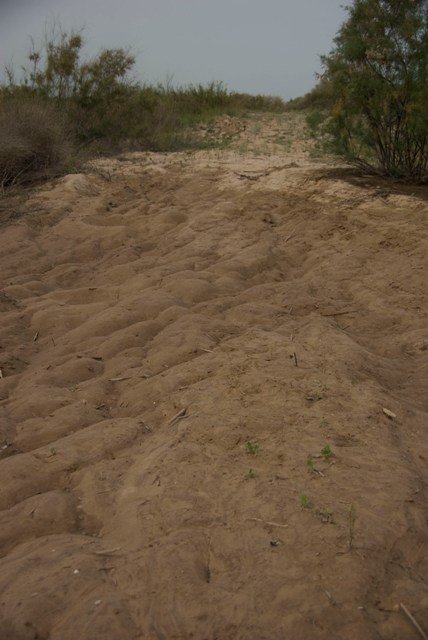
Figure 5-5. Extension zone where river erased evidence of cracking (N32.244815 W115.052872).
Photo by Scott Brandenberg, April 17, 2010.
Figure 5-6. Unseated span of railway bridge near Guadalupe Victoria, B.S. due to movement of the pier toward the Colorado River (N32.244294° W115.052978°). Photo by Diane Murbach, April 10, 2010.
Figure 5-7. Pier on west side of river nearly unseated due to pier deformation caused by lateral spreading (N32.244388° W115.053516°). Photo by Scott Brandenberg, April 17, 2010.
Figure 5-8. Highway bridge directly adjacent to the railroad bridge. Piers on this bridge did not appear to translate due to lateral spreading, but differential settlement occurred, possibly as a result of liquefaction-induced down drag.
Photo by Jim Gingery, April 10, 2010.
Figure 5-9. Approximately 0.5m of ground settlement at highway bridge. Railroad bridge in background.
Photo by Jim Gingery, April 10, 2010.
5.1.2 Universidad Autonoma de Baja California Buildings, Pedestrian Bridge, and River Culvert
5.1.2.1 Buildings
Evidence of liquefaction and settlement was observed at the Universidad Autonoma de Baja California (UABC) Facultad de Ciencias Administrativas campus in Mexicali. A map of the site is shown in Fig. 5-10, and a photo of the buildings is shown in Fig. 5-11. The site consists of four identical four-story steel braced frame structures, a single three-story structure, and a pedestrian bridge. The site was constructed on young unconsolidated alluvial sediments with a high ground water table along a bend in the New River. The river was eventually channelized in a culvert allowing the construction of the roadways and the University campus on the young sediments (Fig. 5-12).
Surface evidence of liquefaction was widespread at this site. Sand boils were present within the lawn and patio areas surrounding the buildings of the campus (Fig. 5-13), and settlement of the ground relative to the structures was apparent. We believe the settlement is caused predominantly by post-liquefaction reconsolidation since the site was essentially level. Some small signs of lateral ground displacement were observed at the northeast corner of the 3-story building, and along the south-facing wall of Bldg. B, where a horizontal gap with maximum thickness of 100mm was measured between the floor slab and surrounding ground. However, these lateral deformations were smaller than vertical displacements at these locations, and lateral deformations were localized to only a few areas. Observations of vertical settlement in the absence of lateral deformation were far more prevalent.
The ground settlement caused cracking and settlement of the floor slab and exterior slabs around the perimeter of every building at the site. Significant architectural damage occurred within the buildings. Interior walls were detached from the slab, acoustical drop ceilings were damaged, and doorframes were distorted. The combination of floor slab and architectural damage rendered the buildings unusable. A common damage pattern to the floor slab involved large settlements of the slab at the midpoint between columns, and no apparent settlement at the column locations (Fig. 5-13). The New River floodplain is a widely recognized liquefaction hazard in Mexicali, and the steel H-section columns were reportedly founded on groups of 25 meter long piles (Carlos Reyes, personal communication). The team observed that the structure exhibited no signs of distress that would be associated with differential settlement between adjacent columns, hence we conclude that the pile groups did not exhibit any measurable settlement due to the earthquake. On the other hand, the floor slabs were cast directly on the ground surface and settled significantly between the pile groups. At positions above the pile groups, the floor slab did not settle because it was supported by the underlying pile groups (notice the small settlement at the column at the corner of the building in Fig. 5-14). The floor slabs were apparently not designed to span unsupported between the columns.
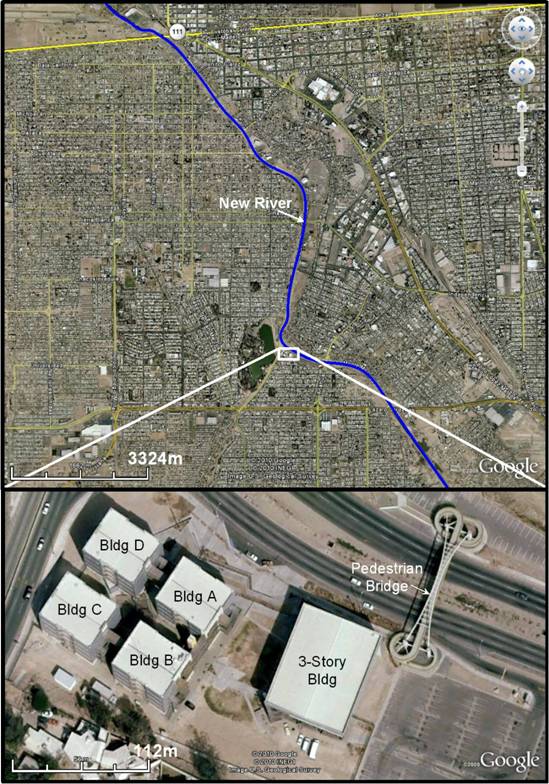
Figure 5-10. Site map of the Universidad Autonoma de Baja California buildings in Mexicali. Google Earth images from January 31, 2008. Northwest corner of building D at approximately (N32.630260°, W115.483642°).
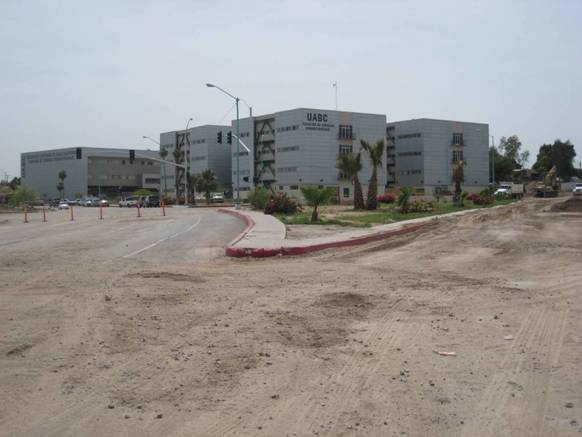
Figure 5-11. View of the UABC campus looking to the southeast. (N32.631281°, W115.484071°).
Photo by Scott Brandenberg, April 10, 2010.
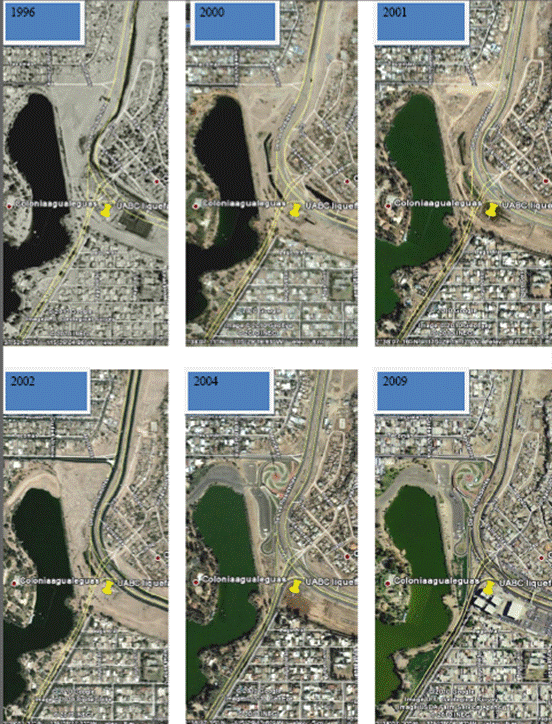
Figure 5-12.
Historical aerial photos showing culvert construction for New River and construction of UABC buildings.
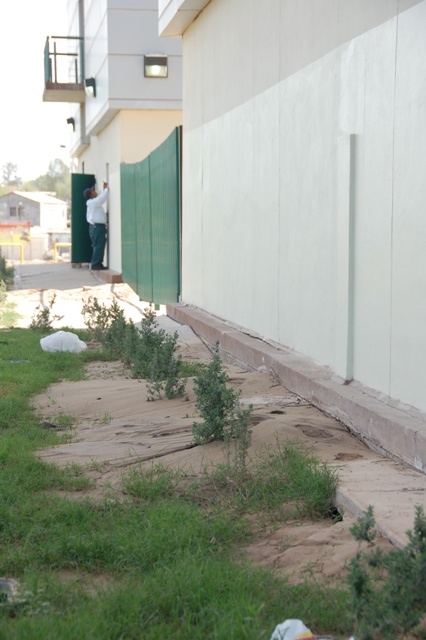
Figure 5-13. Sand boils adjacent to buildings at UABC site. Photo by Jim Gingery, April 10, 2010.
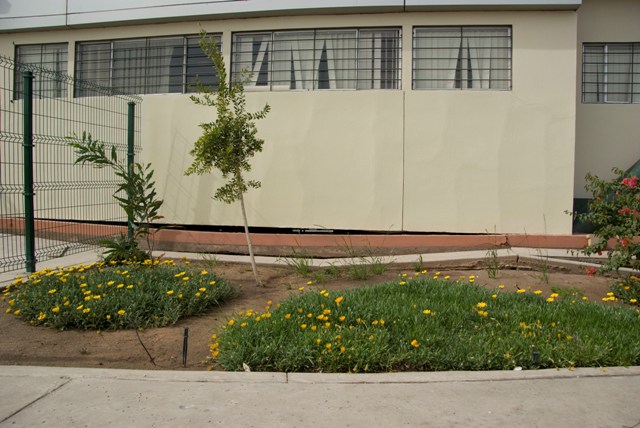
Figure 5-14. Damage to floor slab of UABC site on the north-facing wall of Bldg D. Photo by Scott J. Brandenberg, April 17, 2010 (N32.63021° W115.48363°).
Since the pile groups apparently did not settle, they provided a reference point for measuring ground settlements. Typically, the exterior walls (non-structural) did not settle because they were supported between the columns, hence a gap formed at the bottom of the wall as the floor slab settled. Furthermore, settlement of the soil relative to the floor slab could be inferred based on marks left on the floor slab by the surrounding soil, or by the external concrete slab or external pavers. These vertical offsets were measured at various positions along the perimeter of the buildings as shown in Fig. 5-15. The resulting settlement patterns are plotted in Fig. 5-16. Both the floor slab and external slab/pavers exhibited very little settlement at the column locations due to the presence of the pile groups. Hence, measurements near the mid-points between columns are most indicative of soil settlement at the site.
The largest vertical ground displacements occurred at locations where lateral ground displacements were also observed, hence it is impossible to separate the settlement contribution from post-liquefaction volume change from that caused by deviatoric straining. For example, over 300mm of vertical separation was measured at the northeast corner of the 3-story building, but the ground sloped gently toward the east and exhibited signs of small lateral displacement in the form of ground cracks. Additionally, large vertical ground displacements (over 200mm) were also observed on the south-facing wall of Bldg. B, where lateral ground displacement was also apparent in the form of a horizontal gap with maximum width of 100mm between the floor slab and surrounding soil. Signs of horizontal ground displacement were not encountered along the perimeter of Bldgs. A and D, hence these settlements are likely caused by volume change of the underlying soil. Vertical displacements for these buildings were as large as 150mm.

Figure 5-15. (a) configuration of exterior wall, floor slab, and exterior slab before and after earthquake, (b) measurement of gap between exterior wall and floor slab, (c) measurement of differential settlement between floor slab and exterior slab. Photos by Scott J. Brandenberg, April 17, 2010.
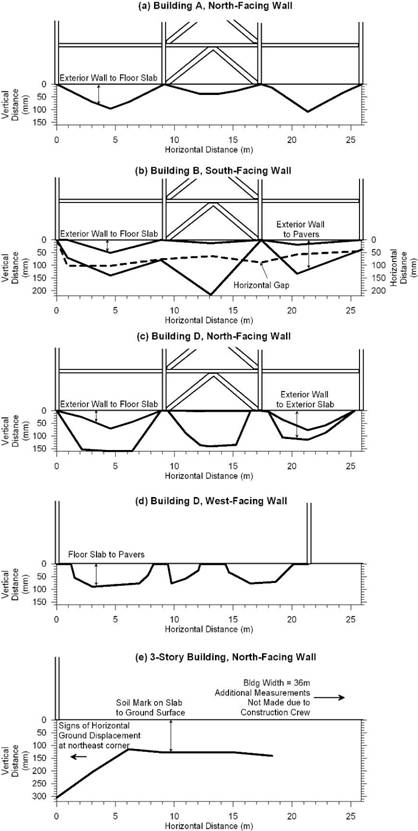
Figure 5-16. Relative displacement measurements for various walls at UABC site.
5.1.2.2 New River Culvert
Approximately 90m northeast of the UABC campus buildings, damage occurred to a parking lot and a box culvert containing the New River (Rio Nuevo). The asphalt concrete parking lot sloped gently toward the east. Extensional ground cracking aligned in the direction perpendicular to the slope and liquefied soil sand boils indicated that lateral spreading had occurred (Fig. 5-17). The roof of an approximately 90-m long section the of concrete box culvert containing the New River (Rio Nuevo) collapsed (Fig. 5-18). Since the culvert is positioned near the toe of the sloping parking lot, lateral spreading displacements toward the culvert may have caused or contributed to its collapse.
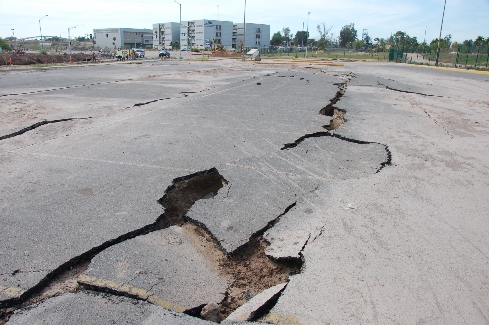
Figure 5-17. Southeast view of parking lot adjacent to UABC where liquefaction and sloping ground lateral occurred (N32.6323203° W115.4844869°). Photo by Jim Gingery, April 10, 2010.
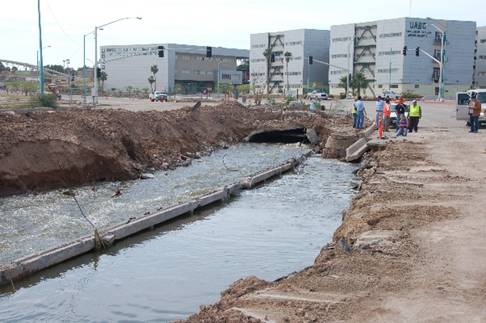
Figure 5-18. Southeast-facing view of collapsed section of New River concrete box culvert (N32.6317853° W115.4840737°).
Photo by Jim Gingery, April 10, 2010.
5.1.3 Centro Estatal de Evaluacion y Control de Confianza Building
A two-story braced steel frame building called "Centro Estatal de Evaluacion y Control de Confianza" owned by the Baja California Secretary of Public Safety located in the New River floodplain suffered liquefaction-induced differential settlement. An isometric architectural rendering of the structure is shown in Fig. 5-19. The structural components of the building were completed at the time of the earthquake, but the building was not yet occupied. Fig. 5-20 shows a plan view of the building from the design drawings overlain on a Google Earth image taken before construction began. The structure was built directly atop the previous position of a channel running parallel to the New River culvert. Each column was supported on a single 0.7m diameter, 20.5m long drilled shaft. The structure suffered differential settlement on the order of 150mm, with the western wall of the building settling more than the eastern wall (Carlos Reyes, personal communication). No damage to the structural components, floor slab, or cladding was evident, though rotation of the floor slab could be felt standing in the structure, and visible rotation of the structure was apparent. Surface evidence of liquefaction was not present near the building. A theory discussed in the field during reconnaissance was that deep liquefaction caused a reduction in bearing capacity at the tips of the drilled shafts, resulting in predominantly rotational building settlement without surface evidence of liquefaction. More detailed geotechnical site investigations will be required to determine whether this explanation is plausible, and whether horizontal variability in the soil properties might explain the observed differential settlement pattern.
Figure 5-19. Isometric view of Construccion de Centro Estatal de Evaluacion y Control de Confianza, Secretaria de Seguridad Publica (Carlos Reyes, personal communication).
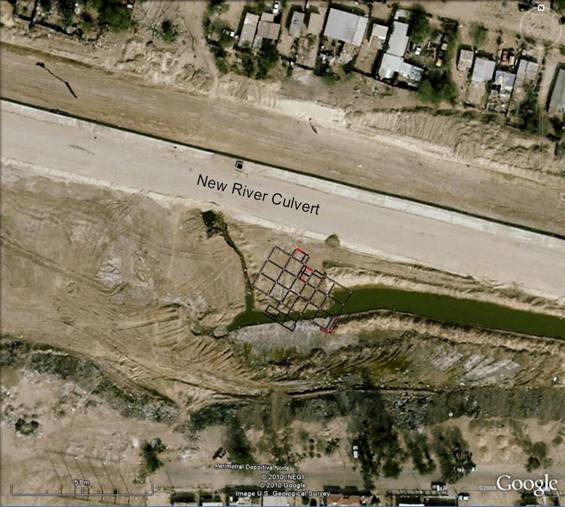
Figure 5-20. Location of Construccion de Centro Estatal de Evaluacion y Control de Confianza, Secretaria de Seguridad Publica (northwest corner of building approximately at N32.61134° W115.45732°). Google Earth image from 01/31/2008.
5.1.4 Residential and Agricultural Areas in the Mexicali Valley
South of the City of Mexicali, the broad Mexicali Valley comprises agricultural land and occasional small villages. The villages consist of mainly one- and two-story houses, likely built without formal engineering or construction quality assurance testing/inspection. Construction materials and systems include unreinforced masonry with bricks and concrete blocks, wood, and confined masonry. Since these villages are located within the Valley and amid irrigated agricultural land that is close to sea level, groundwater occurs close to the surface.
Surface manifestations of liquefaction were observed over extensive areas of the Mexicali Valley. This included sand boils, ground cracking, ejecta, and pools of water. During the reconnaissance visit on April 10, 2010 (six days after the main shock), fresh ejecta were observed, suggesting the occurrence of liquefaction induced by recent aftershocks. Residents claimed water geysers reaching heights of up to 2 m occurred, and that water ejection had also occurred with aftershocks. Villages significantly affected with widespread damage induced by liquefaction included Zacamoto and Oaxaca.
The vast majority of damage to residential structures was caused by liquefaction and associated ground deformations and loss of bearing capacity. Damage was most severe in areas where lateral spreading occurred. Lateral spreading was observed and reported along the Rio Nuevo (New River), and Rio Hardy (Hardy River) and near bodies of water. Many housing units were severely damaged by the effects of liquefaction lateral spreading. Figures 5-21 and 5-22 show lateral spreading displacements along the Hardy River. Figures 5-23 through 5-25 show lateral spreading damage to residences along the Hardy River.
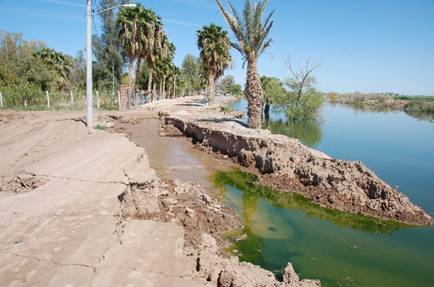
Figure 5-21.
Lateral spreading at farm house area along the Rio Hardy (N32.2378949°, W115.3031776°).
Photo by Jim Gingery, April 10, 2010.
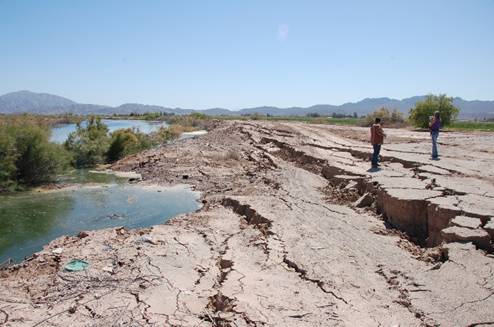
Figure 5-22. Lateral spreading along the Rio Hardy (N32.2378949° W115.3031776°). Photo by Jim Gingery, April 10, 2010.
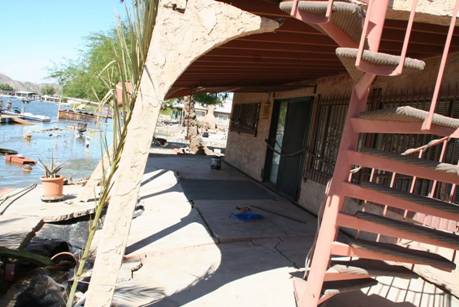
Figure 5-23. Vacation housing units damaged by lateral spreading along the Rio Hardy (exact location unknown).
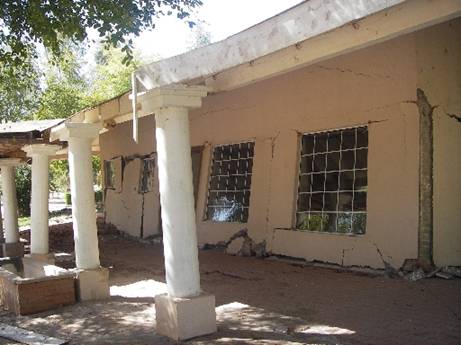
Figure 5-24. This residence, situated about 60 m from a free face at the Rio Hardy, suffered severe damage from lateral spreading displacements (N32.2380682° W115.301572°). Photo by Diane Murbach, April 10, 2010.
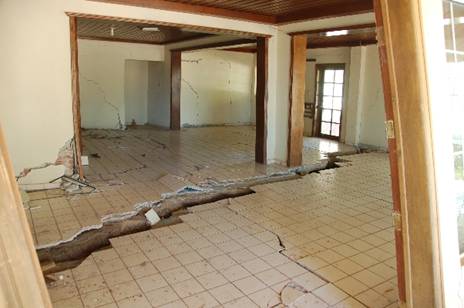
Figure 5-25. Interior of residence (exterior shown in Figure 5-21) damaged by lateral spreading (N32.2383828° W115.3014691°).
Some structures that had settled excessively, apparently due to bearing capacity failure, were also observed (Fig. 5-26). Many residential structures situated within areas where surface manifestations of liquefaction were evident showed little or no signs of damage. Even though many residential structures suffered moderate to severe damage, complete collapse was rare and as a result the number of casualties in residential areas was relatively low.
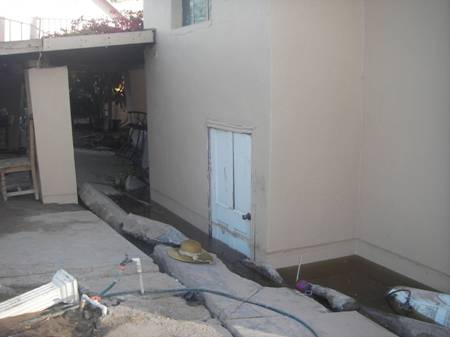
Figure 5-26. This two story structure in the village of Oaxaca settled approximately 1m, probably due to a liquefaction-induced punching-type bearing capacity failure (N32.3495416°, W115.1797356°). Photo by Diane Murbach, April 10, 2010.
Agriculture in the Mexicali Valley was impacted by damage of crops (Fig. 5-27) and irrigation canals (Fig. 5-28). Locals reported sand boils with hot muddy water and reddish water with a sulfur odor boiling out of the ground. Subsidence in the Valley has submerged fields of wheat and hay under water, and disturbed the gentle slopes engineered into the fields to provide a gradient for irrigation. Large areas of crops were covered by liquefaction ejecta. The loss of irrigation will likely result in the loss most of the Valley’s crops, and is expected to have a significant economic impact on this area.
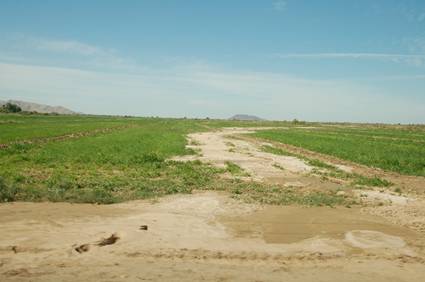
Figure 5-27. Sand boils liquefaction ejecta affecting crops in Mexicali Valley (N32.2890994° W115.3174737°). Photo by Jim Gingery, April 10, 2010.
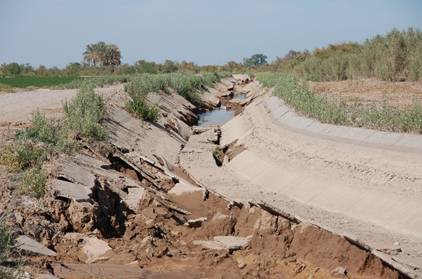
Figure 5-28. Liquefaction damage to agricultural irrigation canals (N32.3144438° W115.2648077°).
Photo by Jim Gingery, April 10, 2010.
5.2 Observations North of the Border
The GEER team performed reconnaissance north of the border for a period of about one week following the earthquake. Three separate teams coordinated their efforts. Brandenberg and Stewart arrived on April 5th and stayed for only one day. John Tinsley (USGS) and Robert Sickler (USGS) arrived on April 6th and stayed for several days. Tim McCrink (CGS) and Cynthia Pridmore (CGS) arrived on April 8th and also stayed for several days. Efforts concentrated on readily accessible locations, chiefly along major and minor roads, principal irrigation canals and drains, and along reaches of the New and Alamo Rivers. Observations present a reasonably coherent picture indication that liquefaction-related ground failure and associated permanent ground deformation were most common in the southwestern portion of the Imperial Valley, with a notable exception located northwest of the town of Holtville (Figure 5-29). There were no surprises in terms of the type of ground deformation observed. Lateral spreading, ground cracking, differential settlement and vented sand (sand blows or “sand boils”) were commonly noted. All locations of reported liquefaction from the 1979 M6.9 Imperial Valley earthquake visited in this reconnaissance were found to not have experienced liquefaction during this earthquake, with the possible exception of small slumps along the All American Canal east of the Alamo River.
5.2.1 Areal Geology
The unconsolidated and partly consolidated deposits of the Imperial Valley include alluvium derived from the Colorado River, plus local contributions that fed intermittent lakes such as Pleistocene Lake Cahuilla. The Cahuilla lake beds where preserved are relatively less permeable than the overlying alluvium and thus tend to perch ground water at relatively shallow subsurface depths, thereby likely enhancing the probability of liquefaction in post-Lake Cahuilla strata, if sufficiently intense ground shaking occurs. During this liquefaction reconnaissance, we made no effort to evaluate the influence of the lake beds on observed liquefaction, but these lake beds are known to perch ground water within the Lake Cahuilla high shoreline elsewhere in the Imperial Valley such as near the Salton Sea well to the north of the area reconnoitered. The New River and Alamo River drainages are inset into older Holocene alluvium, and represent the region’s youngest and least-consolidated, most liquefaction-susceptible deposits. Where roads and canals cross these active depositional systems, earthquake-triggered liquefaction most commonly was observed, with liquefaction occurring in the fill materials themselves and/or in the subjacent late Holocene river alluvium. Not discerned nor addressed as part of this reconnaissance is the nature of any potential geological controls on the location of liquefaction-related ground failures, such as might be occasioned by buried stream channel deposits or other depositional facies known to be especially susceptible to liquefaction provided saturated ground water conditions prevail.
5.2.2 Ground Motion and Liquefaction
A section addressing strong ground motion generated by the El Mayor-Cucupah earthquake is presented in Chapter 4. Here, we note peak horizontal ground accelerations as recorded at a few key sites in the Imperial Valley in the context of liquefaction. Strong motion seismograph stations are not evenly distributed geographically in the Imperial Valley. Stations are concentrated in the El Centro-Imperial-Brawley area, but no stations are sited in the western part of the area near the Westside Main Canal. Detailed modeling of ground motion at liquefaction sites is beyond the scope of this reconnaissance report.
The El Centro instrumental array recorded substantial peak horizontal ground acceleration (PGA) values as high as 0.58 g (at McCabe School, west of El Centro), with a number of stations in the El Centro area recording PGA values exceeding 0.25 g. At Holtville Post Office, PGA was about 0.19 g. The Westmoreland Fire Station instrument recorded 0.16 g and lies beyond the geographic limit of liquefaction in New River deposits as observed in our field reconnaissance. For one brief comparison, for the 1989 Loma Prieta earthquake (Mw 6.9) in the San Francisco Bay Area, the southern limit of liquefaction was observed in active channel deposits of the Salinas River to occur at (or slightly above) a PGA value of 0.12 g as recorded at a station in Salinas. Thus, liquefaction in the Imperial Valley in this event apparently required 0.2 to 0.3 g to develop surface expression of liquefied susceptible materials. The range of recorded PGA values was more than sufficient to cause the observed liquefaction, although the details of the geographic distribution of those levels of ground motion are not precisely known. Figure 5-29 shows strong ground motion stations recording the 4/4/2010 El Mayor-Cucapah main shock in the Imperial Valley/Calexico area.
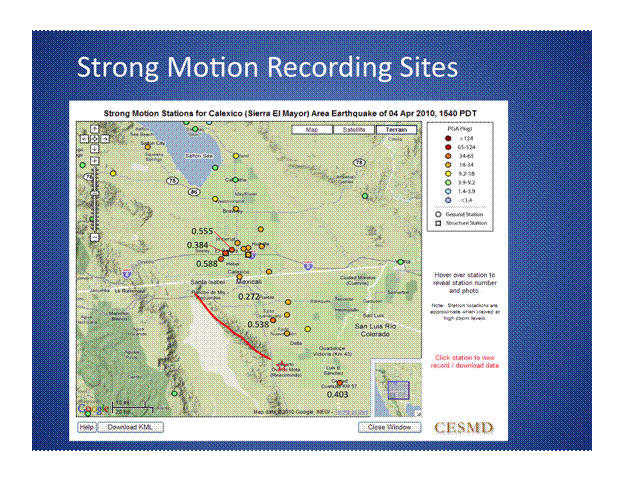
Figure 5-29. Strong ground motion seismograph stations recording the 4/4/2010 El Mayor-Cucupah main shock in the Imperial Valley/Calexico area. Stations grouped by recorded levels of peak horizontal ground acceleration. Highest recorded levels bracket Interstate 8 north and west of Calexico. No stations exist along the western margin of the southern Imperial Valley.
The results of the week-long multi-agency reconnaissance concentrated on readily accessible locations, chiefly along major and minor roads, principal irrigation canals and drains, and along reaches of the New and Alamo Rivers. The collective observations are summarized in Figure 5-30 and show the general nature of the observed ground failure effects.
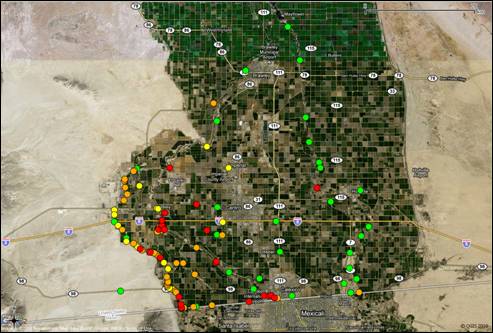
Figure 5-30. Map incorporating Google Earth image as a base, showing the distribution of sites visited during the liquefaction reconnaissance in Imperial County. Red dots show sites where liquefaction could be confirmed by the presence of sand boils, sand/silt filled fissures, or eyewitness accounts. Orange dots indicate sites where the nature of the observed ground deformation was consistent with liquefaction being the primary cause, but no ejected or vented sand was observed. Yellow dots show sites where liquefaction may have contributed but is not required to explain the observed ground deformation. Finally, green dots are sites where no evidence of liquefaction was found. The Alamo River, New River, All American Canal, and Westside Main Canal courses are revealed by alignments of dots showing loci of observations.
The collective observations above present a reasonably coherent picture indicating that liquefaction-related ground failure and associated permanent ground deformation were most common in the southwestern portion of the Imperial Valley, with a notable exception located northwest of the town of Holtville. There were no surprises in terms of the type of ground deformation observed. Lateral spreading, ground cracking, differential settlement and vented sand (sand blows or “sand boils”) were commonly noted. All locations of reported liquefaction from the 1979 M6.9 Imperial Valley earthquake visited in this reconnaissance were found to not have experienced liquefaction during this earthquake, with the possible exception of small slumps along the All American Canal east of the Alamo River.
We now present field observations and commentary with captioned photographs that record our collective observations of principal liquefaction–related impacts and effects of the El Mayor-Cucapah earthquake north of the Mexican border.
5.2.3 Drew Road at New River
Considerable liquefaction-related damage occurred to Drew Road at the bridge crossing the New River. Most of the damage was to the road bed where underlain by approach fill. Sand boils were found adjacent to the fill east of the road and north of the river (Figure 5-31), indicating that liquefaction of the soils under the fills likely was responsible for the damage. Clear vertical drops in the pavement on both sides of the bridge indicates that liquefaction-related deformation affected 50 m of road north of the bridge and 30 m south of the bridge.
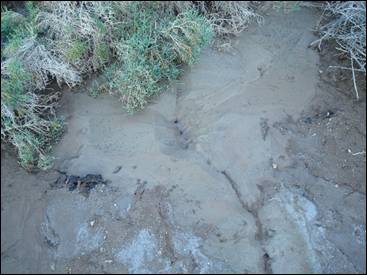
Figure 5-31. Sand Boils in the marshy area east of the north approach fill to the Drew Road Bridge. Lateral spread damage to the road occurred immediately west. Photo by Tim McCrink, 4/8/10. (N32.761972, W115.690217)
The approach fill on the north side of the bridge spread laterally, opening large road-parallel fissures and grabens (Figure 5-32). Pre-existing cracks in asphalt were opened up and showed evidence of adjacent asphalt slabs pounding and grinding against each other. Asphalt adjoining the concrete bridge structure on both sides was pushed up and broken into cobble and gravel size particles (Figure 5-33).
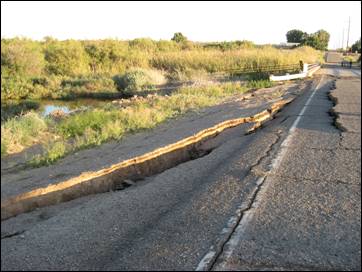
Figure 5-32. Lateral spreading of the north approach fill to the Drew Road Bridge. Sand boils in Figure DR1 are immediately left of this photo. View to the south. Photo by Tim McCrink, 4/8/10. (N32.761978, W115.690337)
Fill at the north bridge abutment dropped at least 10 cm. The pile foundations under the north abutment pushed away surrounding soil 10 to 20 cm, and the concrete abutment was cracked and spalled (Figure 5-34). Combined with the battered asphalt at the bridge edges, the soil disturbance around the piles suggests significant north-south movement of the bridge structure during the earthquake due to shaking.
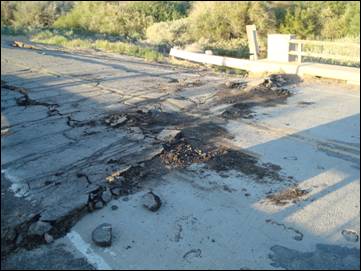
Figure 5-33. Battered asphalt on the north side of the concrete Drew Road Bridge structure. Similar deformation was found on the south side as well. View to the northeast. Photo by Tim McCrink, 4/8/10. (N32.761699, W115.690360).
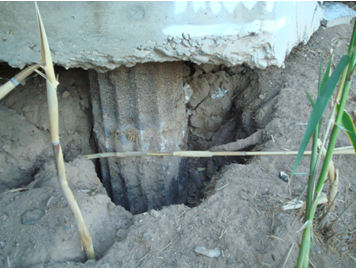
Figure 5-34. View of the pile foundation under the northeast corner of the Drew Road Bridge abutment. Soil pushed away from the pier coupled with the battered asphalt on the road above (Figure DR3) suggests that the bridge structure experience large shaking displacements. Note spalled and cracked concrete in the abutment in the upper right corner of photograph. Photo by Tim McCrink, 4/8/10. (N32.761742, W115.690290).
5.2.4 Brockman Road at New River
The Brockman Road overcrossing of the New River exhibited ground deformation consisting of embankment fill separating from the abutment in the transverse (Fig. 5-35) and longitudinal directions and longitudinal cracking of the pavement at both approaches (Fig. 5-36). The single span bridge had plan dimensions of approximately 10x25 m2, and is supported on concrete piles. On north side of the bridge, separation between the soil and pile of approximately 8 cm was detected. Along both sides of the road, modest ground cracking, settlements and lateral deformation of 8 cm width and 5 cm height are were observed. Surface evidence of liquefaction was not found at this site, though the patterns of ground deformation are consistent with the effects of liquefaction documented at other bridge sites.
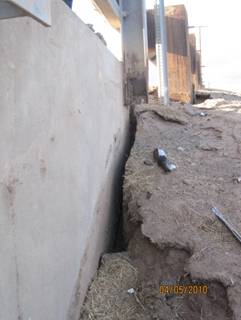
Figure 5-35. Approximately 5cm separation of embankment soil from concrete abutment.
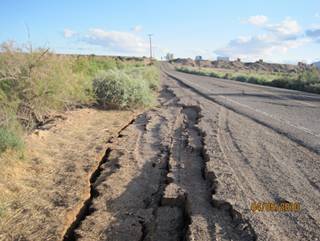
Figure 5-36. Ground cracking, settlement, and lateral deformation along the approach to the Brockman road bridge crossing the New River.
5.2.5 Worthington Road at the New River
The bridge crossing of Worthington Road over the New River is the furthest north confirmed observation of liquefaction along the New River and the resulting damage led to the road’s closure. On the east side of the river, sand boils composed of light gray sand were found on the south side of the bridge approach fill (Figure 5-37a), suggesting the source of the sand is from below the fill. On the north side of the fill, at its base, brown sand was vented (Figure 5-37b), suggesting that fill materials also were involved in liquefaction.
Figure 5-37. Sand boils on approach fill on the east side of the Worthington Road Bridge over the New River. a) Light gray vented sand on the south side of the east approach fill indicates river sediments beneath the approach fill liquefied, while b) brown vented sand at the base of the fill on the north side indicates that fill materials liquefied also. (N32.847303°, W115.681858°)
Photos by Cindy Pridmore on 4/8/10.
Lateral spreading fissures were observed on both sides of the west approach fill (Figure 5-38) but no vented sand was found. The bridge structure exhibited movement in response to strong shaking in the form of pushed soil at the base and sides of the bridge abutments (Figure 5-39). Additional liquefaction-related features include a series of cracks along and parallel to the river’s bank northeast and southwest of the bridge. On the northeast side, the cracks extend up to 100 m north from the bridge and a portion of the river’s bank slumped into the river with a vertical displacement of up to 1 m. On the southwest side, river-parallel cracks were found to extend for about 50 m south of the bridge. Other areas of the river’s bank were obscured from view by dense vegetation. Dense riparian vegetation posed a commonly recurring obstacle and hazard to observers along the principal watercourses during this reconnaissance.
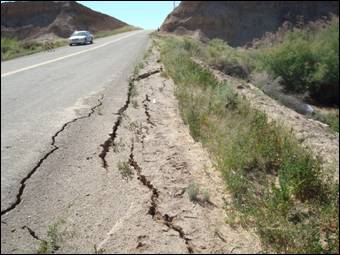
Figure 5-38. Lateral spreading fissures in approach fill on the northwest side of the Worthington Road Bridge over the New River. Similar fissures were observed on the south side, but no sand boils were found. View is to the west. (N32.847359°, W115.683104°). Photo taken by Tim McCrink on 4/8/10.
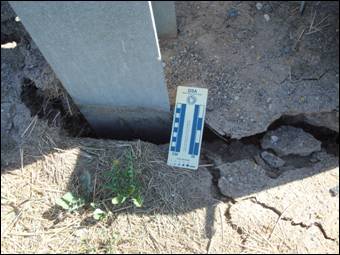
Figure 5-39. Bridge fill pushed away by the Worthington Road Bridge abutment due to strong shaking. (N32.847362°, W115.682537°) Photo taken by Tim McCrink on 4/8/10.
5.2.6 Brockman Road at Greeson Drain
This Brockman road crossing of Greeson Drain consists of a timber bridge supported on timber piles. The plan dimensions of the bridge are approximate 7x8 m. Evidence of liquefaction was readily apparent below the bridge (Fig. 5-40). Settlement at both approaches was significant enough for the authorities to close the bridge to traffic, though it could still be safely crossed at slow speed.
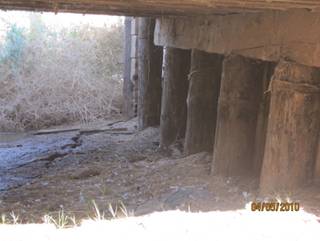
Figure 5-40. Ground cracking beneath Brockman Road bridge crossing Greeson Drain.
5.2.7 Lyons Road at New River
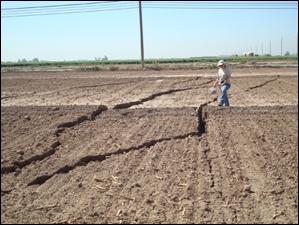
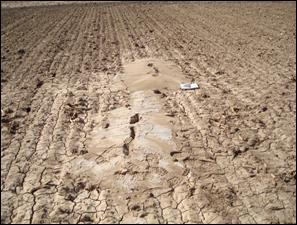
Liquefaction-induced lateral spreading occurred in the New River floodplain at Lyons Road at a distance of a few hundred meters to the west of the New River crossing. Lateral spreading occurred primarily toward the field on the north side of Lyons Road (Fig. 5-41), though deformation to the east toward the river was also apparent. Ground deformation caused horizontal and vertical offsets in the pavement (Fig. 5-42) that caused closure of the road following the earthquake. An irrigation canal adjacent to the road was also significantly damaged (Fig. 5-43). Sand boils consisting of clean fine sand were a clear indication that liquefaction caused the observed ground deformation (Fig. 5-44). Signs of lateral spreading were not apparent at the bridge location.
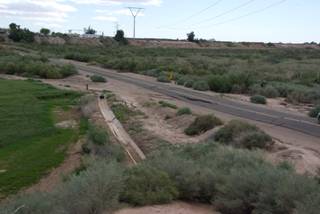
Figure 5-41. View of damage to roadway and irrigation canal due to lateral spreading toward field on left side of image. Photo by Scott J. Brandenberg on April 5, 2010 (N32.716613° W115.607750°).
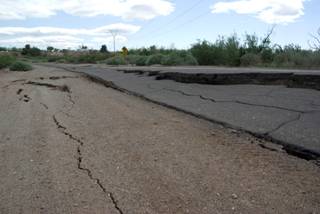
Figure 5-42. Effects of lateral spreading on Lyons Road. Photo by Scott J. Brandenberg on April 5, 2010 (N32.716390° W115.606263°).
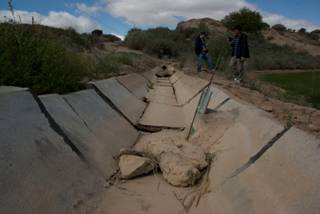
Figure 5-43. Effects of lateral spreading on irrigation canal adjacent to Lyons Road. Photo by Scott J. Brandenberg on April 5, 2010 (N32.716425° W115.606676°).
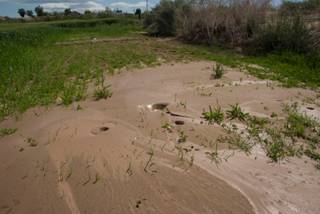
Figure 5-44. Sand boils in field adjacent to Lyons Road. Photo by Scott J. Brandenberg on April 5, 2020 (N32.716504° W115.606829°).
5.2.8 Evan Hewes Highway and Rice Drain No. 3
A large liquefaction lateral spread occurred at the southwest corner of an agricultural field located immediately north of Evan Hewes Highway, halfway between the towns of Seeley and El Centro. The lateral spread moved to the west toward the Rice No. 3 drain (Figure 5-45). The affected area is roughly 80 to 100 m along the Rice Drain, and 90 m from the Rice Drain to the furthest east sand boil.
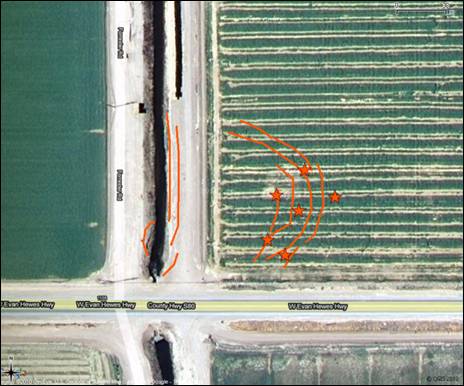
Figure 5-45. Diagrammatic sketch on a Google Maps base of liquefaction features north of Evan Hewes Highway and east of Rice Drain No.3. Lines represent approximate locations of cracks and fissures, and star symbols indicate approximate locations of sand boils.
Repairs to the lateral spread were underway at the time of the visit (4/9/10) and were concentrated on the east bank of the Rice Drain (Figure 5-46). According to the owner of the field, the west-facing bank of the drain was transported across the drain, depositing salt cedar bushes on the opposite bank. The road on the east bank was severely disrupted by open fissures reported to have been up to 1 m wide and 30 cm deep prior to the start of repairs (Figure 5-47). The operator of the sheepsfoot roller working on the repair reported that when he turned on the roller’s vibrator, water “squirted” out of the ground and his roller sank to a depth that required a bulldozer to pull it out.
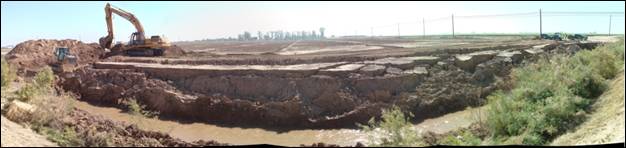
Figure 5-46. Panoramic view of the lateral spread at Evan Hewes Highway (on the right along the line of telephone poles) and Rice Drain No. 3 (foreground). Repairs underway on the left consist of excavation and replacement of the levee materials. Photos taken by Tim McCrink on 4/9/10. (N32.797188°, W115.638077°).
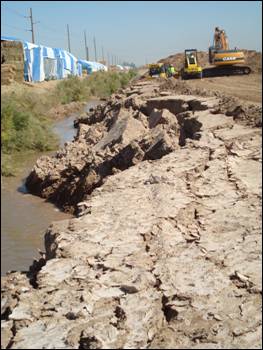
Figure 5-47. View looking north at the lateral spread into the Rice No. 3 Drain. Owner of the agricultural field reported that the salt cedar bushes now on the west bank were on the east bank before the earthquake. (N32.796806°, W115.637789°).
The eastern portion of the lateral spread manifested as a series of arcuate fissures and several sand boils (Figure 5-48). The sand boils were generally not associated with the fissures, but vented within soil blocks between them. However, all fissures wide enough to see into were filled to varying depths with liquefied silty sand. The fissures showed extensional movement from a few mm to 30 cm wide, and a vertical displacement up to 20 cm.
Discussions with the land owner revealed that the “clay tile drains” that are typically installed in most agricultural fields in the area were not installed in the westernmost 500 feet (150 m) of this field. These drains are usually placed at depths of 2 to 3 m at regular intervals. It may be that the absence of these drains contributed to liquefaction at this location.
Figure 5-48. Arcuate lateral spread fissures (a) and sand boils (b) near the eastern extent of the lateral spread at Evan Hewes Highway and Rice Drain No. 3. Photos taken by Tim McCrink on 4/9/10. (N32.797033°, W115.637096°).
5.2.9 Interstate 8 - Westbound On-Ramp at Drew Road
The on-ramp to westbound Interstate 8 at Drew Road at the merge with I-8’s No. 2 lane showed extensional cracking in the road fill and in the pavement carrying Interstate 8 across New River valley near the fill’s east margin. California Department of Transportation (CALTRANS) crews were filling and sanding fractures the morning of 4/7/2010. The pavement of the shoulder of westbound Interstate 8 shows slight differential settlement in fill causing a low spot that no longer will readily drain. CALTRANS likely will have to fix this potential puddle-maker, but repairs are not critical at the present time. Although liquefaction was not confirmed by the presence of vented sand in the extensional fractures, sand blows were present on the New River floodplain on both sides of the New River channel not far from the location of the deformed highway pavement. The highway was not closed, although traffic was restricted on the on-ramp while minor repairs and sanding were completed.
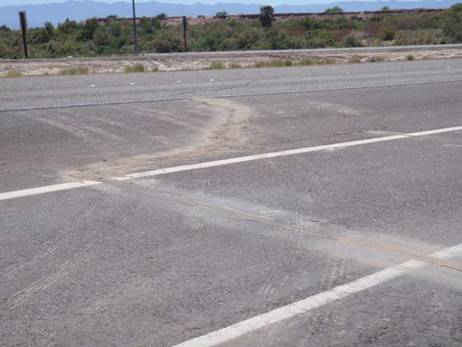
Figure 5-49. Figure I8-1, JT4752 - Interstate 8 at Drew Road: Patched and sanded fractures in westbound lanes of Interstate 8 immediately west of Drew Road on-ramp. Extensional fractures trend en echelon across paved lanes from right shoulder to median strip. Photo taken by John Tinsley on 4/7/10 (N32.77013591°, W115.8003414°)
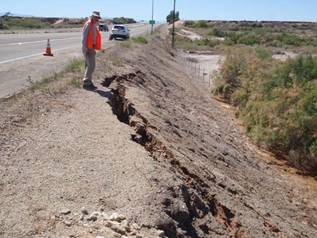
Figure 5-50. Figure I8-2, JT 4755 - Close view showing extensional fractures and failure of fill at westbound Interstate 8 crosses late Holocene alluvium of New River. Liquefaction inferred to be probably on the basis of vented sand shown in the subsequent image. Photo taken by John Tinsley on 4/7/10 (N32.77013591°, W115.8003414°)
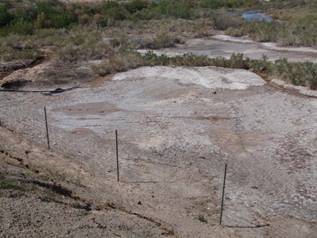
Figure 5-51. Earthquake triggered liquefaction north of Interstate 8 east of New River, with vented sand visible in middle ground. New River is the watercourse visible in background area of image. No vented sand was present associated with the extensional fractures shown in the preceding photo, but these sand blows were only a few tens of meters distant. Photo taken by John Tinsley on 4/7/10 (N32.77013591°, W115.8003414°).
5.2.10 Calexico Waste Water Treatment Plant
The Calexico Waste Water Treatment Plant is located at the southwest corner of the City of Calexico, on the south bank of the New River and immediately north of the Calexico International Airport (Figure 5-52). Extensive liquefaction-related deformation effects were observed on the plant access road east of the airport, resulting in the road’s closure, and on the west side of the plant where liquefaction lateral spreading damaged embankments that impound partially solidified sludge and gray water. Lateral spreading fissures also were observed traversing sludge ponds near the central area of the plant. Liquefaction, lateral spreading and sand boil features also occurred on the north bank of the New River east of the Waste Water Treatment Plant. At the time of the CGS visit, crews were actively engaged in reconnecting a sewer trunk line broken on the north side of the New River. Possible lateral spread fissures were observed on the New River flood plain in this area but the cause of the broken sewer line was not determined. Other activities at the plant included a track-mounted excavator working on a pond embankment in the center of the plant, and two workmen were involved in repairs to a cylindrical tank in the eastern area of the plant.
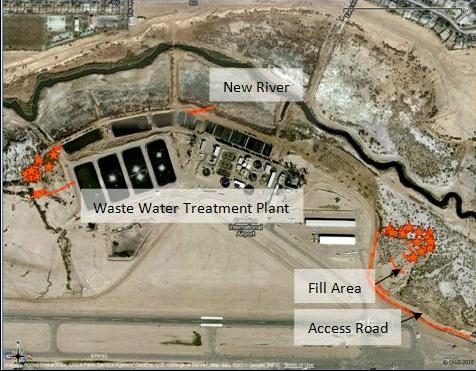
Figure 5-52. Map of liquefaction features at the Calexico Waste Water Treatment Plant on a Google Maps base. Liquefaction-related ground deformation severely affected the access road on the east side of the plant, and fissuring observed on the west side and central area may extend into ponds. Lines represent approximate observed fissure locations; stars represent approximate observed sand boil locations.
Liquefaction damage to the access road extends for a distance of about 350 meters with the greatest damage in the central portion where the road curves. Cumulative vertical displacement on the inboard (southwest) side of the road may be up to one meter maximum, and horizontal displacement is on the order of 20 to 30 cm (Figures 5-53 and 5-54). No evidence of slump/spread movement at the base of the road embankment was found along the southeast half of the damaged access road, perhaps masked by scattered, end-dumped rubble piles. Additionally, no evidence of fissuring or sand boils was observed on the flood plain immediately northeast. Damage to the outboard (east-northeast) side of the road did not become apparent until the road adjoins a large non-engineered fill lying to the east-northeast (Figure 5-52). Here, uphill-facing scarps with less vertical displacement than on the inboard side indicate both settlement and rotation of the road fill prism. Geotextile was found in road base beneath asphalt in an exposed crack on the northeast side of the road, and this may explain why the pavement did not experience the same intensity of damage as the sides of the road. It was reported that this road was reconstructed and paved in the last four years.
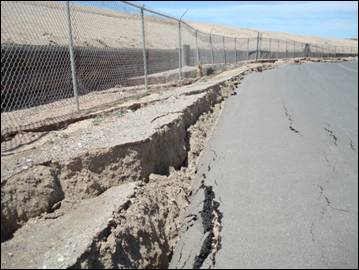
Figure 5-53. Liquefaction lateral spread/slump of Waste Water Treatment Plant access road. A matching but smaller uphill-facing scarp on the other side of the road indicates the soil under the pavement settled and rotated. Geotextile was observed in exposed road base, which may have helped keep pavement from experiencing the intensity of fissuring observed on the sides of the road. View to the west. Photo by Tim McCrink on 4/10/10. (N32.667876°, W115.510150°).
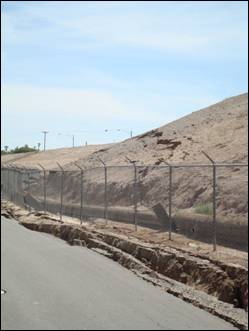
Figure 5-54. Liquefaction lateral spread/slump of Waste Water Treatment Plant access road. A portion of the hill, probably fill, also experienced slumping. View to the southeast. Photo by Tim McCrink on 4/10/10. (N32.667876°, W115.510150°).
Extensional cracks were found throughout most of the fill area, with numerous sand boils occurring toward the northeast where the fill thins. On the flood plain north and east of the fill, numerous fissures and related sand boils were found (Figures 5-55 and 5-56).
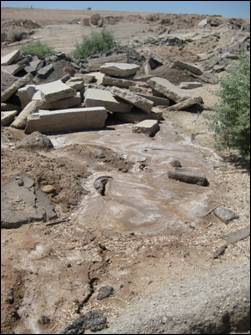
Figure 5-55. Liquefaction sand boils and related fissures in non-engineered fill adjacent to the Treatment Plant access road. Access road is at the base of the hill in the distance and the airport is just beyond. View to the southwest. Photo by Cindy Pridmore on 4/10/10. (N32.668929°,W115.509430°).
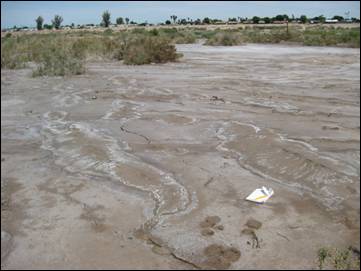
Figure 5-56. Liquefaction sand boils and fissures on the New River flood plain, just north of the non-engineered fill along the Treatment Plant access road. Stains on sand boils are thought to be salts contained in the ground water that turn white upon drying. Most sand boils were wet in this area, and are believed to have been reactivated by a M4.4 aftershock that occurred the night before. View to the north. Photo by Cindy Pridmore on 4/10/10. (N32.669203°, W115.509781°)
The west side of the Waste Water Treatment Plant is characterized by extensive areas of sand boils and lateral spread fissures (Figures 5-57 through 5-58). Sand boils appear confined to flood plain areas, though considerable volumes of sand were ejected. Lateral spread fissures occur on the flood plains associated with sand boils, but extend into and through fill areas, including pond embankments at the plant.
Figure 5-57. Extensive sand boils flooding areas between bushes on the New River flood plain west of the Waste Water Treatment Plant. View to the west. Photo by Tim McCrink on 4/10/10. (N32.607281°, W115.518033°)
Figure 5-58. Lateral spread fissures extending through sludge drying ponds on the west side of the Waste Water Treatment Plant. Fissure in the foreground is extensional and those in the middle of the picture show vertical displacement on the order of 2 to 5 cm. View to the southeast. Photo by Tim McCrink on 4/10/10. (N32.670722°, W115.517776°)
Figure 5-59. Large scarp at the head of a liquefaction lateral spread on the west side of the Waste Water Treatment Plant. Cumulative displacement on the order of one meter. View to the south east. Photo by T. McCrink on 4/10/10. (N32.669853°, W115.517979°)
Figure 5-60. Liquefaction lateral spread fissures extending across New River flood plain into pond embankments on the west side of the Waste Water Treatment Plant. Arrows point to fissures in the embankment. At the time of the CGS visit, a track-mounted excavator (orange machine arm in the top center of this photo) was making repairs in the center of the plant at a point suspiciously in line with these fissures. View to the east from the large scarp shown in Figure TP8. Photo by Tim McCrink on 4/10/10. (N32.669853°, W115.517979°)
5.2.11 All American Canal Aqueduct Over the New River
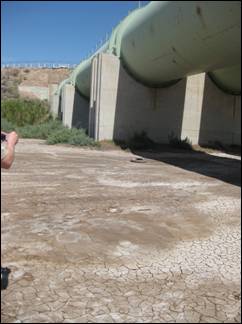
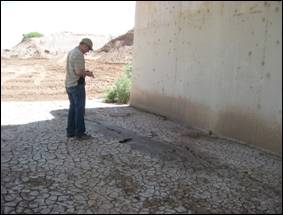
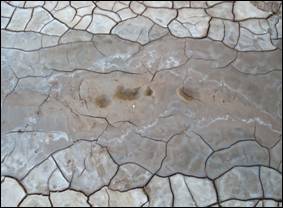
The All American Canal crosses the New River through an aqueduct system composed of two, approximately 4 m diameter pipes, which are elevated above the riverbed by five massive, rectangular concrete supports (Figure 5-61). By 4/10/10 when the site was visited, much of the flat flood plain area of the New River had been graded. However, considerable evidence of liquefaction in this area could still be observed. A 30 m wide lateral spread slump could be seen on the south bank of the New River 150 m upstream from the aqueduct. Sand boils could be found in nearly all flood plain areas left ungraded around the aqueduct, particularly underneath and west of the structure. The sand boils were characterized by very fine-grained ejecta, often displaying shrinkage cracks, and relatively low volume of ejected material (Figure 5-61b and 5-62b). At the base of one concrete support, a linear string of these fine-grained sand boils paralleled the support structure, suggesting some influence of the structure on liquefaction occurring at this location (Figure 5-62).
Figure 5-61. Liquefaction sand boils near the All American Canal aqueduct over the New River. Relatively low volumes of fine-grained ejected material characterize the sand boils in this area. a) View of sand boils on the New River flood plain, looking northeast toward the aqueduct; photo by Cindy Pridmore. b) Close-up of the sand boils; photo by Tim McCrink. (N32.670604°, W115.526947°)
Figure 5-62. Liquefaction sand boils near the base of one All American Canal aqueduct support structure. a) Line of sand boils parallels the support structure; photo by Cindy Pridmore. b) Close-up of the sand boils. Note desiccation cracks forming in ejected material; photo by Tim McCrink. (N32.670459°, W115.526825°)
|